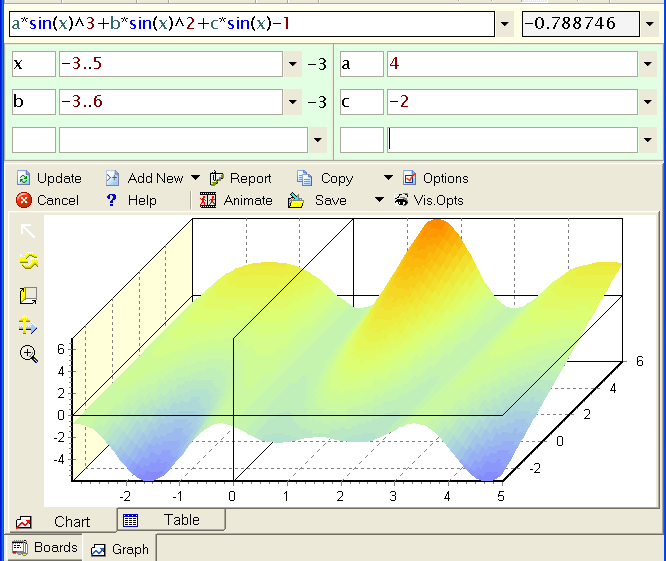
To draw 3D surface is equally simple, just pick an expression with at least two variables, set ranges for these two and click chart button.
Explicit presentation
This example is a follow up from 2D chart first example with additional range variable (b).

The tool-bar buttons on the left will allow to manipulate the surface (from top to bottom):
Parametric presentation
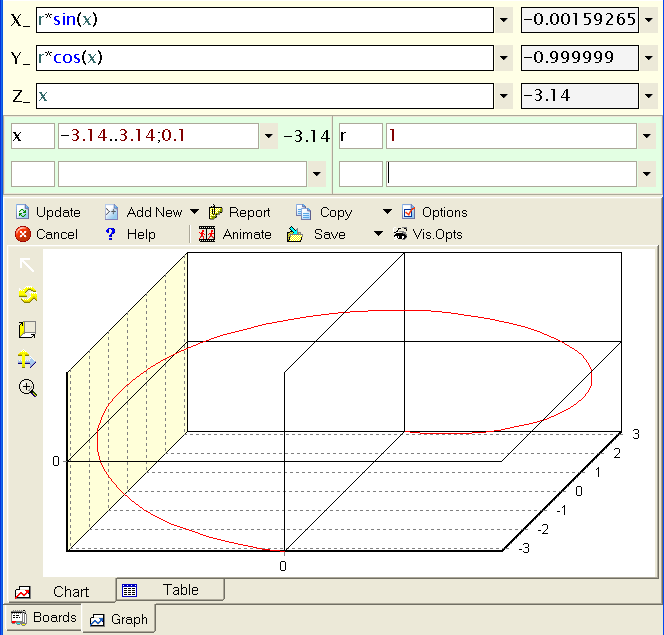
A 3D curve is define by three expressions (for the three axis) and one range variable.

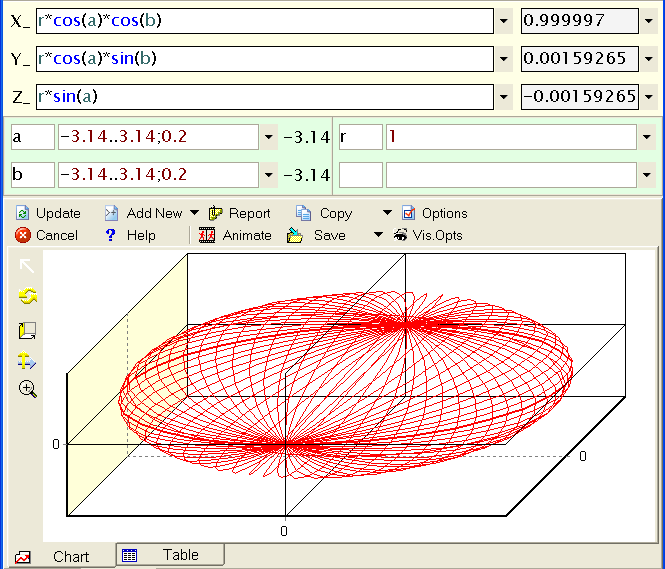
A 3D surface (or pseudo-surface) is define by three expressions (for the three axis) and two range variables.
