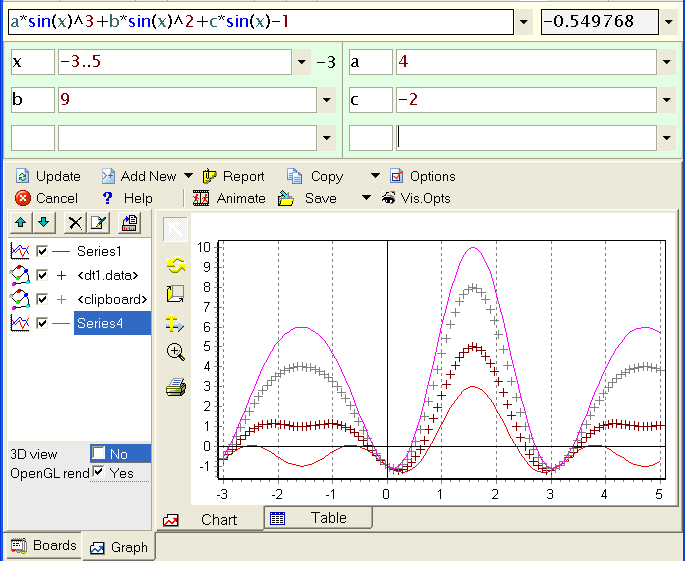
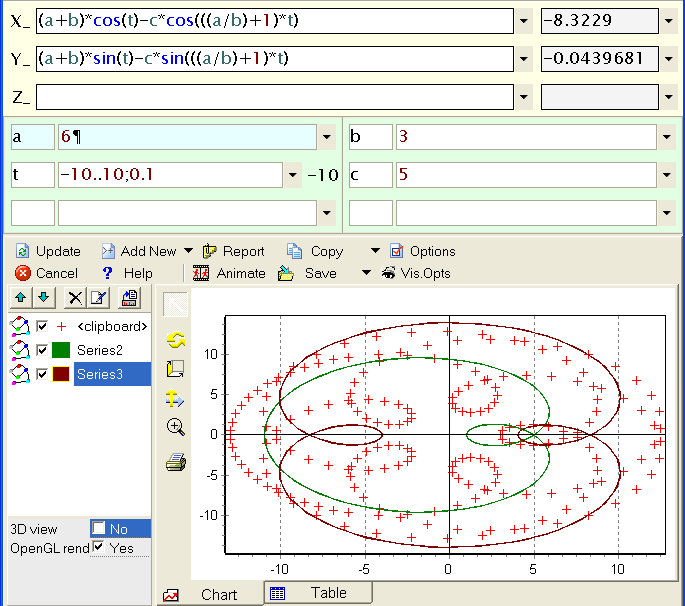
In multi-chart you can draw as many graphs as you want, mixing function curves and data sets.
You start drawing, simply writing an expression and at least one range variable and then press Chart button.
You can hide and show a series un-checking and checking the check-box in front of the series.
Using the buttons on the top of the series list, you can move a series up / down, delete or rename a series.
If a series is from expression (Sicyon project) you can retrieve that project with Copy back button. So in a sense that could serve you as project depository (along with Undo Log, which is more universal, because it accepts projects with no range variable).
Once your first graph is drawn you can add new ones from "Add new" menu:
Update button will repeat the curve drawing of the active (selected) graph
from the source it was taken from.
So if you have taken data set from the clipboard, select that series and click
Update Sicyon will take clipboard and redraw the series.
If you use Chart button on the main menu that would be the same as you close chart module (Cancel button) and click Chart button.
When you close the chart module depending of the Options -> Graph -> On close delete one of the following will happen:

The same as above goes for parametric curves as well.
